ScatterPlot
#include "toolkit/charts/scatter_plot.hpp"
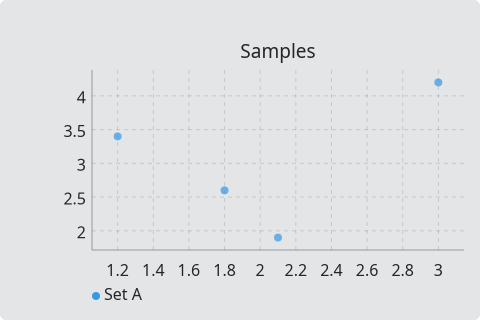
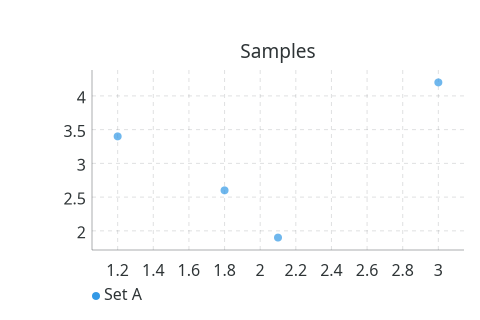
A multi-series scatter plot with grid, legend, hover tooltips, and pan &
zoom (see the charts overview). Inherits Widget.
- macOS
- Material
- Windows 11
- Windows 95
- Plasma 6
- GNOME
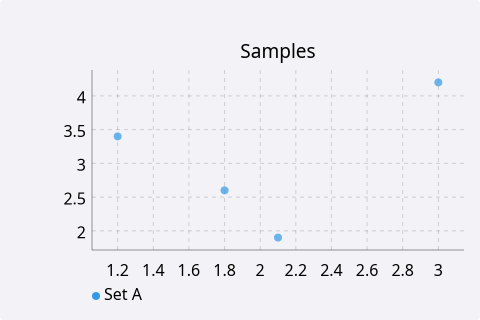
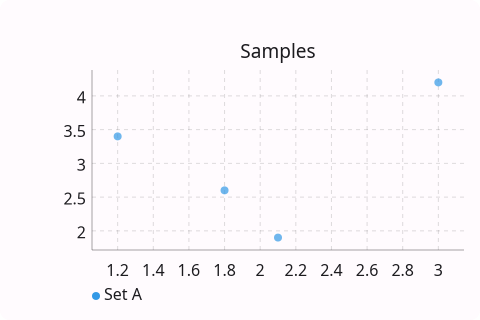
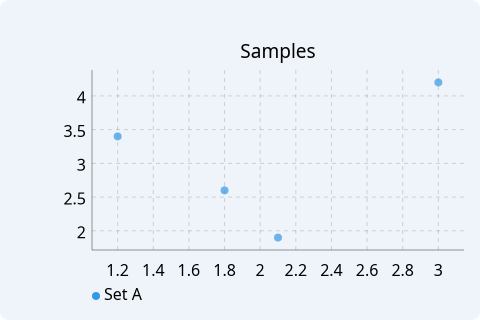
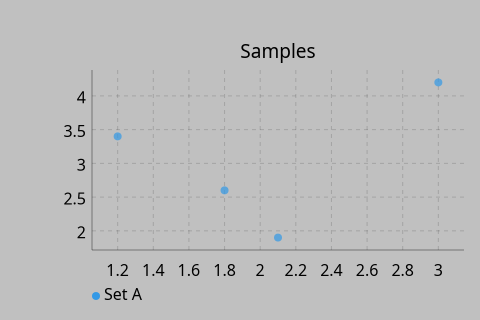
Data types
struct ScatterPoint { float x, y; std::string label; };
struct ScatterSeries { std::string name; Color color; float point_radius = 3.0f; std::vector<ScatterPoint> points; };
Example
auto chart = std::make_unique<toolkit::ScatterPlot>();
chart->add_series({"Samples", toolkit::Color::rgb(0.2f, 0.6f, 0.9f), 4.0f,
                    {{1.2f, 3.4f, ""}, {2.1f, 1.9f, ""}}});
Construction
ScatterPlot();
API
| Member | Description |
|---|---|
add_series(ScatterSeries) / clear_series() / series_count() | Manage data series |
set_title(std::string) | Chart title |
set_x_label(std::string) / set_y_label(std::string) | Axis labels |
set_show_grid(bool) / set_show_legend(bool) | Toggle chrome |
Callbacks
| Callback | Description |
|---|---|
on_hover — std::function<void(size_t series_idx, size_t point_idx)> | Fired as the pointer hovers a point |